Home/Products/Fund Attribution
Available now

Every basis point,
explained.

Daily NAV attribution and tracking-difference decomposition for any fund with a benchmark index — active or passive, ETF or mutual fund. Fund Attribution explains, every day, exactly why a fund's return differed from its benchmark, down to the individual security.
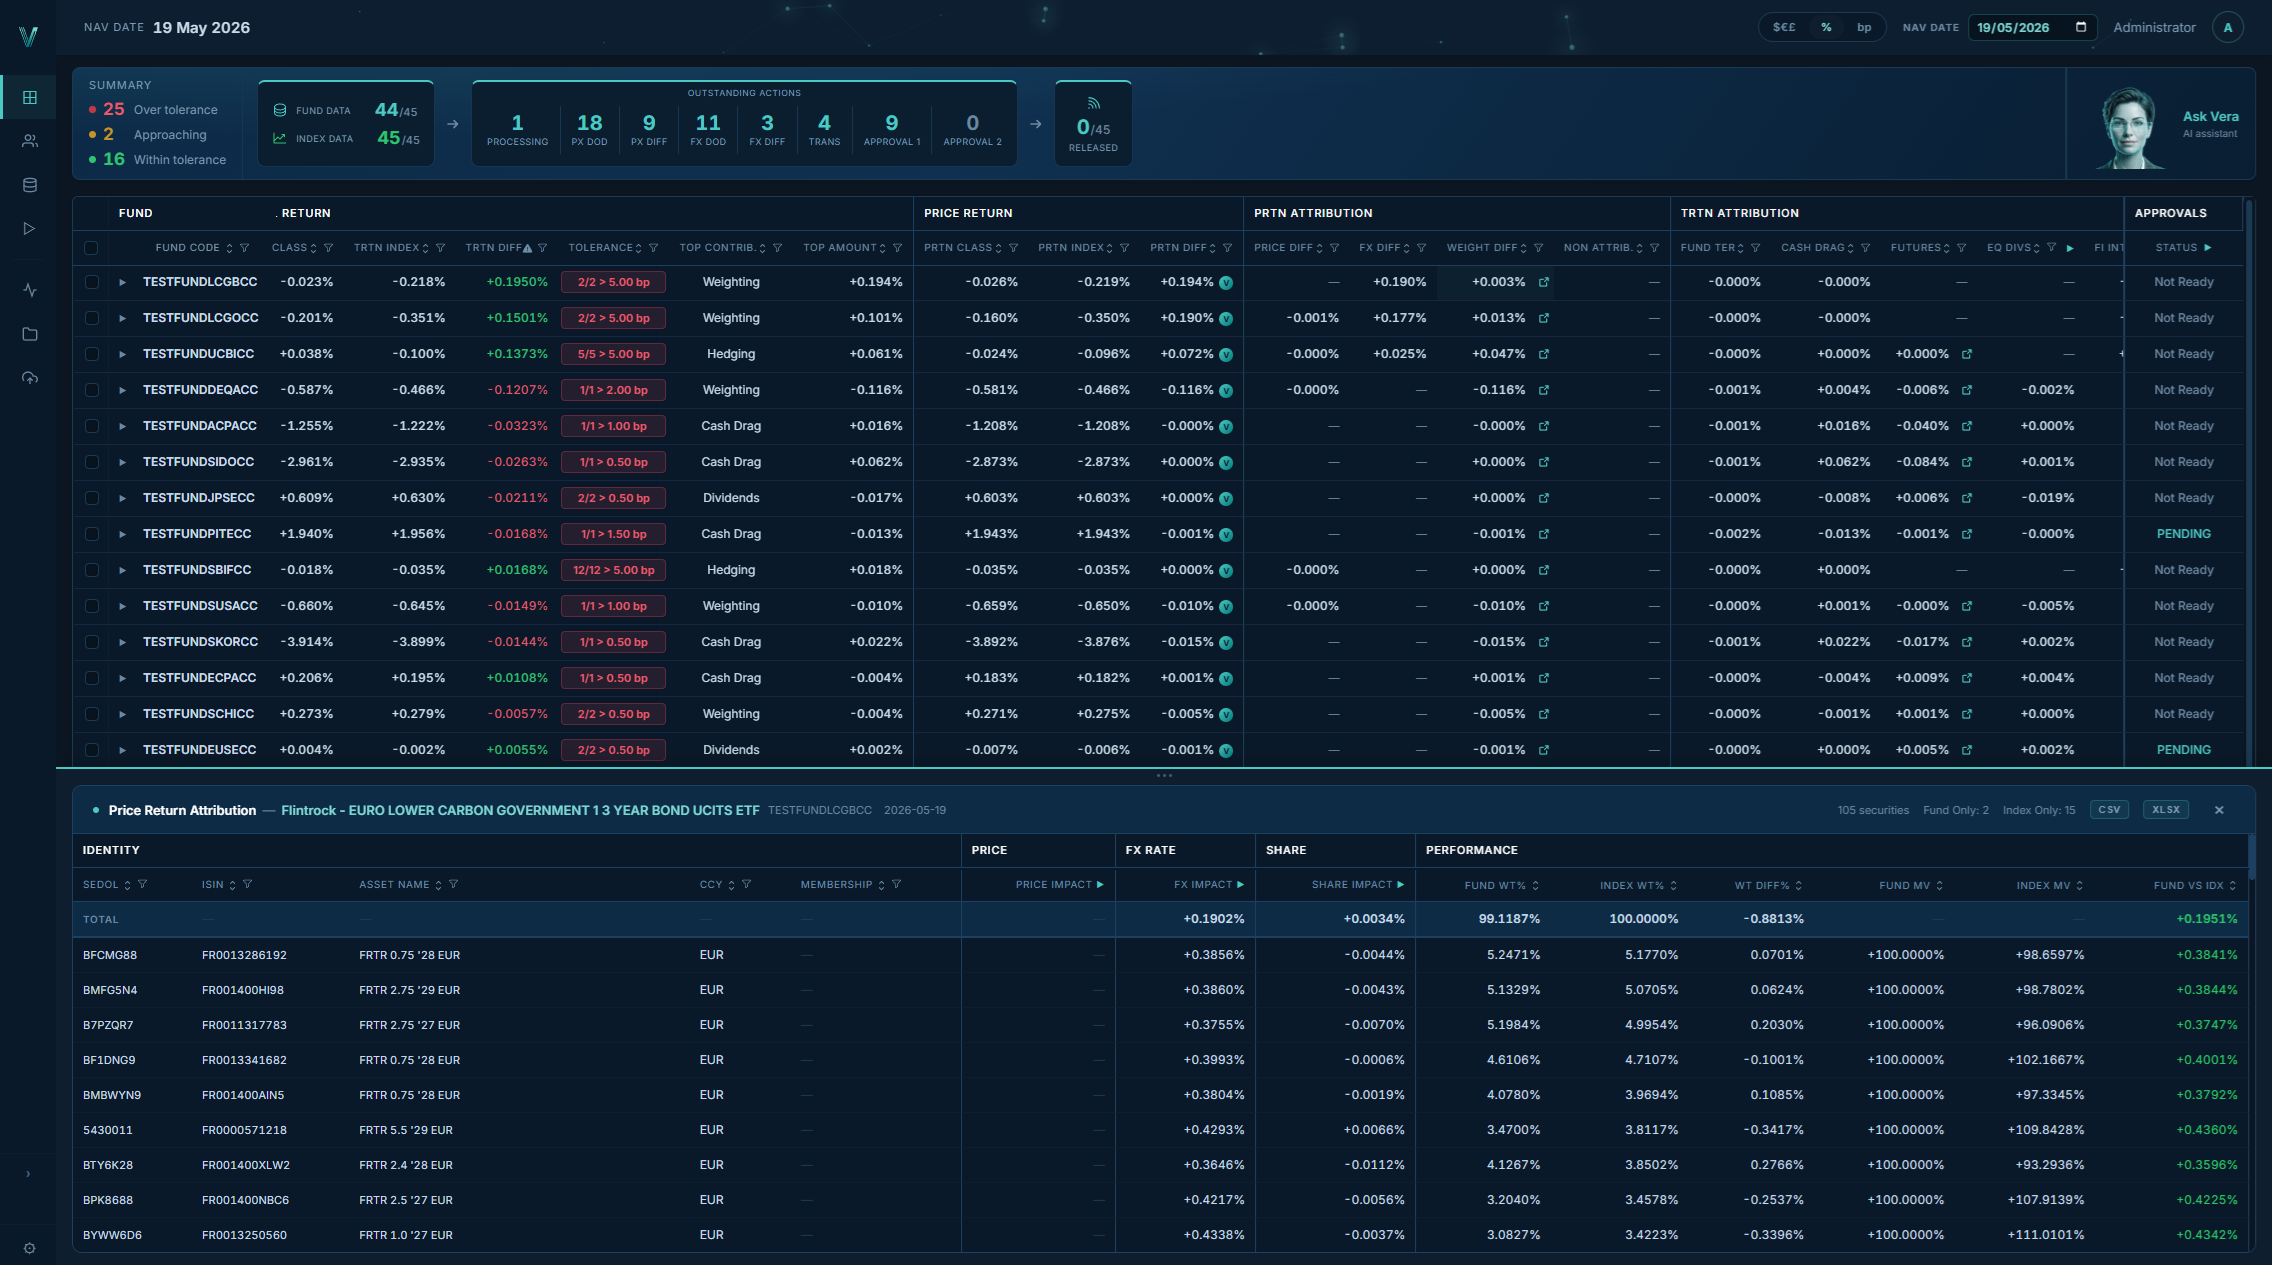
Fund Attribution dashboard — daily attribution across the fund range with a price-return drilldown open
1Fund-range summary
2Outstanding actions
3Tolerance checks
5Security-level drilldown
6Ask Vera
4Attribution columns
1 Fund-range summaryEvery fund's tracking status at a glance — over tolerance, approaching, and within — before you've scrolled anywhere.
2 The day's outstanding actionsData loads, price and FX validations, transactions and both approval levels — counted by stage so the team works the queue, not the inbox.
3 Tolerance checksEach class's tracking difference against its configured tolerance — breaches flagged and sorted to the top of the range.
4 Attribution, componentisedPrice, FX and weight components of the deviation per share class — every figure switchable between monetary, percentage and basis points.
5 Down to the securityAny figure opens its drilldown — here, price-return attribution per security with fund vs index weights, keyed by SEDOL and ISIN.
6 Ask VeraThe AI review lives beside the data — plain-English commentary per fund before anything is signed off.

Production dashboard with a price-return drilldown open — data shown is illustrative.

Attribution shouldn't live
in a spreadsheet.

Daily attribution across a real fund range is one of the most demanding recurring calculations in fund operations — and in most shops it still runs on spreadsheets maintained by hand.

📊
It doesn't scale
A handful of funds is manageable. Hundreds of funds, each with multiple share classes, benchmarks and currencies, is not. Manual attribution grows headcount linearly with the fund range.
🔍
It can't be audited
When the number comes out of a personal workbook, there's no consistent methodology, no change control and no evidence trail. Every review starts from scratch.
⏱️
It's always late
By the time a manual process explains yesterday's tracking difference, today's NAV is already published. Attribution that arrives after sign-off can't protect the sign-off.

From raw data to released
attribution — every day.

One automated daily cycle per fund, per NAV date. Re-running any date is always safe — results are recalculated cleanly, never duplicated.

1
Ingest
Fund accounting data — valuations, transactions, income, ledger — alongside index constituents and index levels from your index data provider.
2
Calculate
Fifteen specialist calculation engines run in four sequential stages: event processing, security-level attribution, income, and the summary roll-up per share class.
3
Validate
Automated checks against configurable tolerances — price day-on-day, price vs index, FX day-on-day, FX vs index — with a documented approval for every exception.
4
Review
Vera reviews every calculation and writes a plain-English note on what moved and why. Two-level approval — processor then authoriser — before anything is released.
5
Release
Signed-off attribution published to the dashboard, with the full calculation and approval history retained in the audit trail.

Tracking difference,
fully accounted for.

The daily gap between fund and benchmark return is decomposed into its real causes — each component in both monetary terms and basis points, each traceable to the securities behind it.

Price return
Security-level price attribution for equities and fixed income — where the fund's pricing moved differently from the index's.
Income — dividends
Fund vs index dividend comparison per security, including withholding tax rates and recoverable WHT.
Income — coupons
Fixed income coupon entitlements, converted to base currency, compared against index income assumptions.
Dealing
The impact of subscriptions and redemptions, including the FX effect of dealing flows against the NAV point.
Rebalancing
Index rebalancing and non-standard trades, with trade-date-aware FX treatment and the associated FX impact isolated.
Currency hedging
Forward-FX hedge effectiveness per hedged share class — hedge ratio, hedge P&L and the estimated unhedged comparison.
Corporate actions
Splits, mergers, spin-offs and fixed income capital events, with the P&L of each event isolated from market movement.
Futures
Futures P&L reconciliation, split into market and FX components, for funds that equitise cash with derivatives.
Cash & currency
FX movement on cash and non-benchmark currency positions — the quiet source of drift most processes never isolate.

Fourteen drilldowns.
No dead ends.

Every headline number opens. Fourteen interactive drilldowns take any component of the day's tracking difference down to the individual security — keyed by SEDOL for equities and ISIN for fixed income.

Price, FX, weight, dividends, coupons, accrued interest, corporate actions, hedging, dealing, rebalancing and futures each have a dedicated view — with per-column filtering, frozen identity columns and totals that reconcile to the summary above them.

Values display the way you work: monetary in the fund's base currency, percentage, or basis points — switched globally with one toggle.

One day, one share class — decomposed
Price return vs index+2.1 bp
Dividend income vs index+1.4 bp
Dealing impact+0.5 bp
Rebalancing−0.3 bp
Currency hedging+0.2 bp
Corporate actions0.0 bp
Cash & currency FX+0.3 bp
Tracking difference, explained+4.2 bp
Illustrative example — figures shown are for demonstration only.

Vera reviews every fund,
every day. Live

After every calculation, Vera — the Veracis AI — reviews the results before they reach your approvers and writes a plain-English note against each fund: the largest contributors by name, price and FX exceptions against the index, unattributed return, and movements that look like corporate-action effects.

🧭
Reads the day for you
The commentary tells your reviewers where to look before they start looking — securities named, exceptions counted, tolerances flagged.
🔒
Never touches the numbers
The calculations are deterministic and auditable to the basis point. Vera reads the results; she never alters them.
📝
On the record
Every note is stored against the fund and NAV date alongside the approvals — part of the same audit trail as the sign-off itself.

More about Vera →

Built for production,
not presentations.

Fund Attribution runs as a daily production system with the controls an operations team actually needs.

  • Any fund with a benchmark index — active or passive, ETF or mutual fund
  • Multi-share-class, multi-currency, multi-administrator support
  • Two-level approval — processor and authoriser — on every release
  • Documented approval for every tolerance exception
  • Full audit trail on calculations, checks and sign-offs
  • Safe re-runs — recalculating a date can never double-count
  • Monetary, percentage and basis-point display with one toggle
  • Works alongside any fund accounting platform — no replacement, no migration

See your funds
explained.

We're working with our first pilot clients in Ireland. If daily attribution is still a spreadsheet in your shop, we'd love to talk.

Request a demo

Tell us a little about your organisation and we'll be in touch within one business day.

By submitting, you agree to our Privacy Policy.

No commitment required Responses within one business day Pilot programme available